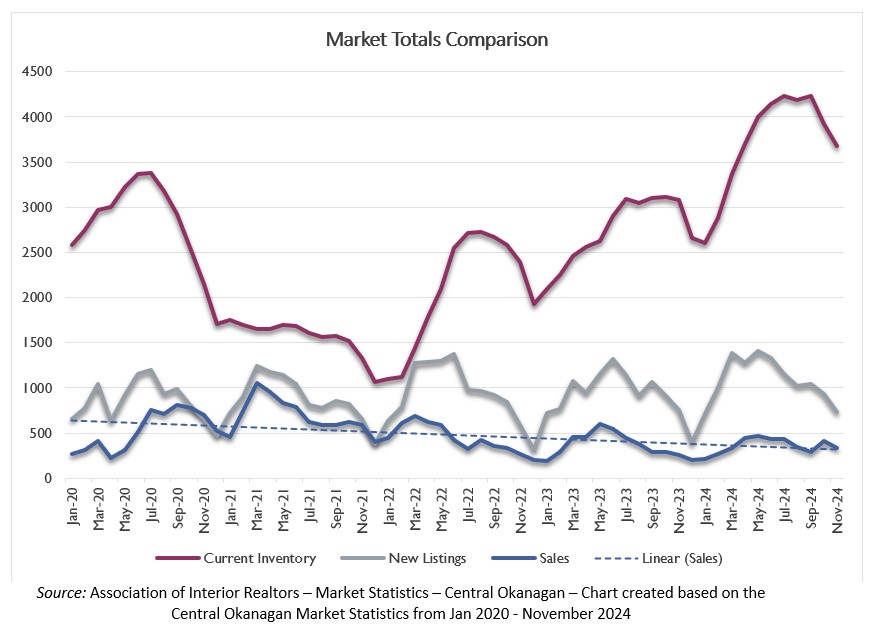
MARKET ANALYSIS
Market Report - Central Okanagan, November 2024
Property Type | New Listings | Current Inventory | Sales | Days on the Market | Average Price | List/Sale Ratio |
|---|---|---|---|---|---|---|
Single Family | 244 | 1252 | 123 | 70 | $1,064,556 | 96.46% |
Condo | 183 | 687 | 98 | 63 | $502,373 | 97.65% |
Townhouse | 107 | 384 | 50 | 60 | $667,860 | 96.68% |
Lots | 35 | 384 | 7 | 124 | $806,000 | 91.30% |
Source: Association of Interior Realtors – Market Statistics – Central Okanagan – Table created based on the Central Okanagan Market Statistics for November, 2024
Market Totals - Central Okanagan
Months | November 2024 | November 2023 |
|---|---|---|
New Listings | 729 | 760 |
Current Inventory | 3637 | 3079 |
Sales | 333 | 254 |
Days On Market | 74 | 61 |
Total Sales Volume | $281,538,594 | $206,119,390 |
List/Sale Ratio | 94.13% | 93.04% |
Single Family (S.F.) Sales | 123 | 107 |
Total S.F. Sales Volume | $130,940,369 | $112,975,000 |
Source: Association of Interior Realtors – Market Statistics – Central Okanagan – Table created based on the Central Okanagan Market Statistics for November, 2024


#1 – 1890 Cooper Road
Kelowna, BC V1Y 8B7
The trade marks displayed on this site, including CREA®, MLS®, Multiple Listing Service®, and the associated logos and design marks are owned by the Canadian Real Estate Association. REALTOR® is a trade mark of REALTOR® Canada Inc., a corporation owned by Canadian Real Estate Association and the National Association of REALTORS®. Other trade marks may be owned by real estate boards and other third parties. Nothing contained on this site gives any user the right or license to use any trade mark displayed on this site without the express permission of the owner.
powered by webkits
